Daytime Sleepiness and Depression
Question
Do people who feel overly sleepy during the day report more depressive symptoms?
Key Finding
Adults who reported feeling excessively sleepy during the day tended to report substantially higher depression scores. Sleepiness frequency showed a moderate correlation with PHQ-9 scores (Spearman r = 0.397) and explained about 16% of the variation in depression severity.
Initial Hypothesis
Yes — I expected a moderate positive relationship. Feeling exhausted during waking hours seems like it would take a toll on mood, or at minimum co-occur with depression.
Dataset
NHANES 2017–2018, National Center for Health Statistics.
- SLQ — Sleep Disorders questionnaire. The key variable is SLQ120: “In the past month, how often did you feel excessively or overly sleepy during the day?” Responses are ordinal: 0 = Never, 1 = Rarely (1×/month), 2 = Sometimes (2–4×/month), 3 = Often (5–15×/month), 4 = Almost Always (16–30×/month).
- DPQ — Patient Health Questionnaire (PHQ-9) depression screener, same instrument as Investigation 001.
View the analysis notebook on GitHub
Cleaning
The sleep (SLQ) and depression (DPQ) datasets were joined on respondent ID (SEQN), keeping only participants with data in both questionnaires. The sleep dataset had 6,161 records; the depression dataset had 5,533. The inner join produced 5,533 participants.
NHANES codes refused and “don’t know” responses as 7 or 9. These were replaced with missing values (NaN) in both the sleepiness question and all nine PHQ-9 items. Rows missing any of these variables were then dropped. The final dataset contains 5,060 participants.
The PHQ-9 total score was calculated as the sum of DPQ010–DPQ090 (nine items, each scored 0–3, range 0–27). DPQ100, a functional impairment follow-up question, is not part of the PHQ-9 score and was excluded.
Analysis
Correlation
Spearman correlation was used as the primary measure because both variables are ordinal and PHQ-9 scores are heavily right-skewed. Pearson correlation is included because it is the most commonly reported correlation coefficient, allowing comparison with studies that assume continuous variables.
| Method | r | p-value |
|---|---|---|
| Pearson | 0.359 | <0.0001 |
| Spearman | 0.397 | <0.0001 |
Both correlations are positive and in the moderate range (0.30–0.50). People who experience daytime sleepiness more frequently tend to report higher depression scores. Both associations were highly statistically significant (p < 0.0001), reflecting both the strength of the relationship and the large sample size.
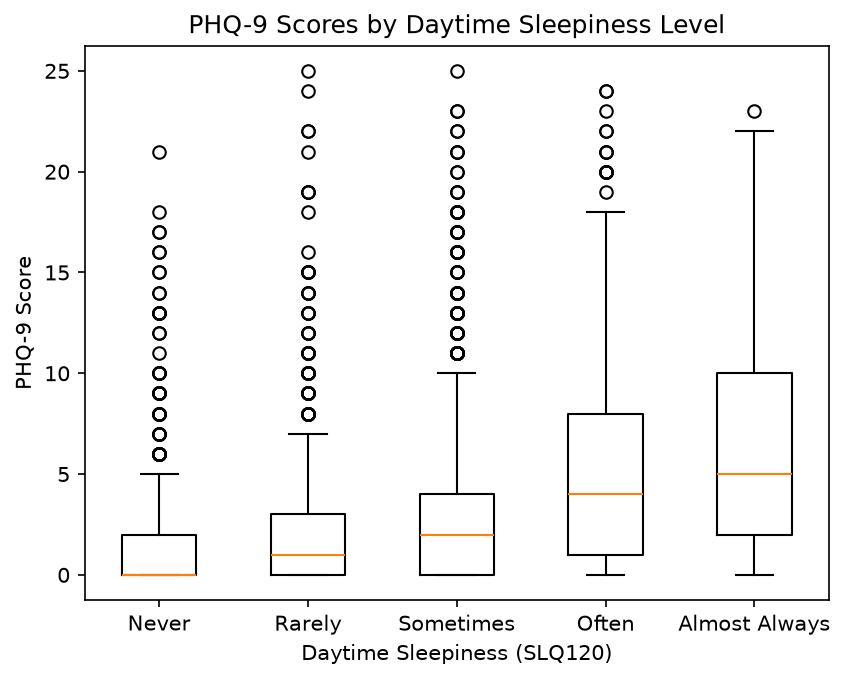
The box plot makes the trend visible: median PHQ-9 scores climb steadily from 0 (Never) to 5 (Almost Always), and the spread of scores increases along with the median.
Regression
To estimate how PHQ-9 changes across increasing levels of daytime sleepiness, a linear regression was run with SLQ120 as the predictor and PHQ-9 score as the outcome. Because PHQ-9 scores are right-skewed with many zeros, the outcome was log-transformed using log(phq9 + 1) before fitting the model.
| Statistic | Value |
|---|---|
| Slope | 0.311 |
| Intercept | 0.468 |
| r | 0.397 |
| R² | 0.158 |
| p-value | <0.0001 |
R² = 0.158: about 16% of the variation in PHQ-9 scores is explained by daytime sleepiness frequency. The remaining 84% reflects factors not captured in this model.
In behavioral and public health research, where outcomes are influenced by many biological, psychological, and social factors, a single predictor explaining roughly 16% of the variability is noteworthy.
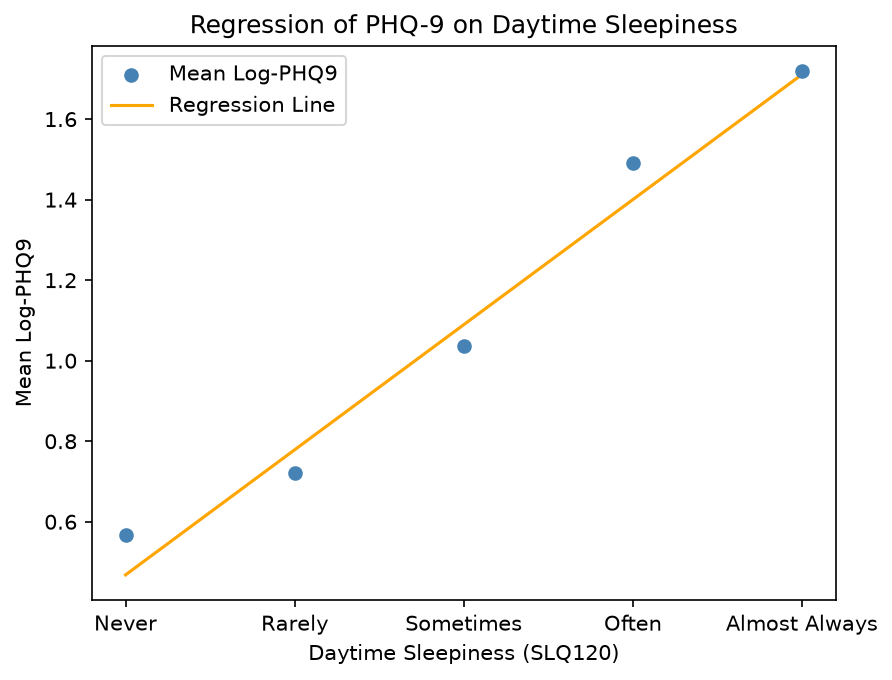
Four of the five group means sit close to the regression line. The “Never” group is a slight exception — the model underestimates depression scores for people who never feel sleepy. The jump from “Sometimes” to “Often” is also larger than the other steps, suggesting the relationship may not be perfectly linear across all levels.
Limitations
Heteroscedasticity. The spread of residuals is not constant across predicted values — it decreases as sleepiness increases. This violates the homoscedasticity assumption of linear regression. The log transformation reduced the problem but did not eliminate it. Under ordinary least squares, the coefficient estimates remain unbiased if the usual assumptions hold, but heteroscedasticity can make the standard errors unreliable. Robust standard errors would provide more trustworthy inference.
Single-variable model. Daytime sleepiness and depression are both influenced by many overlapping factors — chronic illness, medication side effects, age, lifestyle. This model controls for none of them. The 84% of unexplained variance is a reminder of how much is left out.
Correlation, not causation. This analysis cannot determine whether sleepiness contributes to depression, whether depression causes sleepiness, or whether both are driven by a third variable.
Sample representativeness. The 628 participants who completed the sleep questionnaire but not the depression screener were excluded. If these individuals differ systematically from those who completed both (e.g., due to health status or survey fatigue), the results may not generalize to the full NHANES sample.
Ordinal predictor treated as continuous. SLQ120 has five ordered levels, not a true numeric scale. Treating it as continuous in a linear regression assumes equal spacing between levels, which may not hold — the data suggests the jump from “Sometimes” to “Often” is larger than the other steps. Treating the predictor as categorical rather than continuous would allow each sleepiness level to have its own estimated effect.
If I Had More Time
- Test for nonlinearity. The regression residuals and the uneven step between “Sometimes” and “Often” both suggest the relationship may curve. A polynomial term or a nonparametric smoother would be worth trying.
- Compare with Poisson regression. PHQ-9 is a count variable, which makes Poisson or negative binomial regression a theoretically better fit than log-transformed linear regression. Comparing the two models would show whether the choice of approach meaningfully changes the conclusions.
- Use robust standard errors. Given the persistent heteroscedasticity, rerunning the regression in
statsmodelswith robust standard errors (HC3) would produce more trustworthy confidence intervals without changing the coefficient estimates. - Add covariates. Age, sex, BMI, and chronic illness are all likely confounders. A multivariable model would help isolate the independent contribution of daytime sleepiness to depression symptoms.
Next Investigation
003 — TBD